Real-time monitoring
Your pixels break silently. Not anymore.
Tracking errors go unnoticed for days. You find out when your client calls or your dashboards show weird data. TrustData monitors continuously and alerts you instantly.
Real-time alerts
Configurable automatic alerts
Set your thresholds and notification channels. TrustData monitors 24/7 and alerts you instantly.
- Default alertsTracking errors, sync failures, stale data. Automatically enabled on all plans.
- Custom alertsCreate your own rules. Alert if conversion rate drops 20%, if no events in 2h, etc.
- Multi-channelEmail, Slack, webhook, PagerDuty. Choose how and where to be notified.
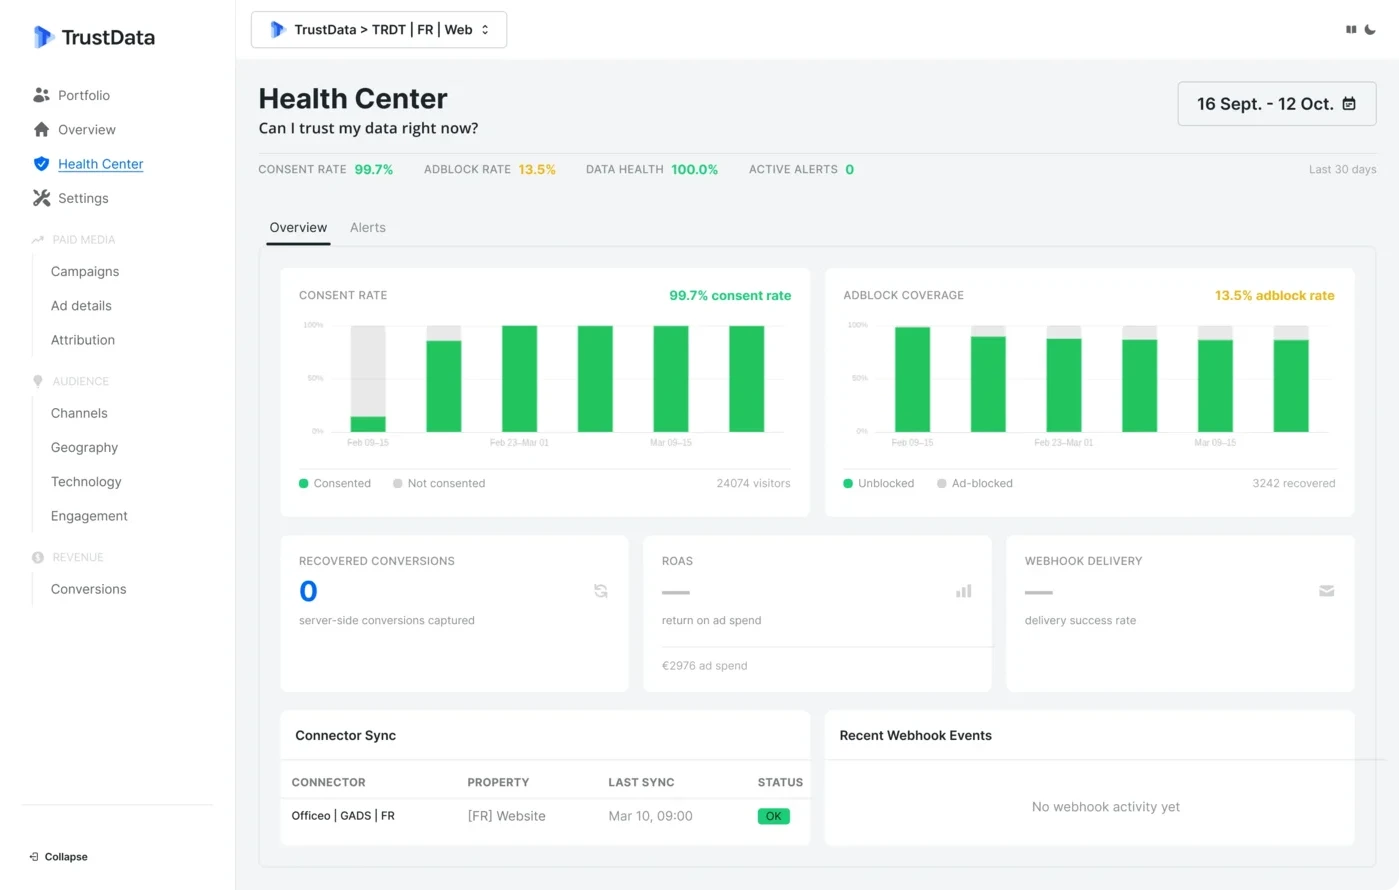
Tracking health
Real-time health dashboard
See the status of all your data sources at a glance. Complete sync and error history.
- Per-source statusEach connector shows its status - green, orange, or red. Last sync, next sync, recent errors.
- Sync historyView the complete history of each source. When did sync happen, how much data, what errors.
- Detailed logsWhen something breaks, you know exactly what and why. Complete traces for debugging.
Diagnostics
Diagnostics and resolution
Don't just know there's a problem. Understand why and how to fix it.
- Clear error messagesNo cryptic codes. Human-readable explanations of what failed and why.
- Resolution suggestionsFor common errors, TrustData suggests resolution steps.
- One-click reconnectionToken expired? Reconnect the account in one click without reconfiguring.
TrustData vs manual monitoring
Why automate your pixel monitoring.
| Feature | TrustData | GA4 | Others |
|---|---|---|---|
| Error detection | Real-time, automatic | Manual checking | |
| Configurable alerts | Email, Slack, webhook | Limited | |
| Sync history | Complete with logs | Partial | None |
| Diagnostics | Resolution suggestions | ||
| Multi-source | SDK + all connectors | GA4 only | Variable |
Frequently Asked Questions
Stop discovering problems too late
14-day free trial. Default alerts enabled automatically.