Integrity
Fix the data before anyone reads it
The tracking fault is eliminated first, because a data fault makes every downstream number meaningless.
Key takeaway
You are not short of dashboards. You are short of the 30 to 60 minutes an anomaly costs before you can even say what it was, several times a week, always on the day you had something else planned. That checklist is worth automating. The judgement at the end of it is not, which is why every verdict comes back to you.
The triage
When ROAS moves, the first hour is not analysis. It is elimination: was it the pixel, the spend, the creative, the funnel, the UTM labelling, or the market. Six checks that have to be run in order and that nobody enjoys running.
The tracking fault is eliminated first, because a data fault makes every downstream number meaningless.
Deterministic, data-backed or contextual, labelled rather than blended into one confident paragraph.
Each investigation records whether a known pattern matched or it could only report facts.
The audit
You are the person who gets asked where a number came from, and "the tool said so" is not an answer you can give twice. Everything here is built to be checked.
Page audit bands ship with a floor and a ceiling as numbers, because a threshold you can argue with beats a grade you cannot.
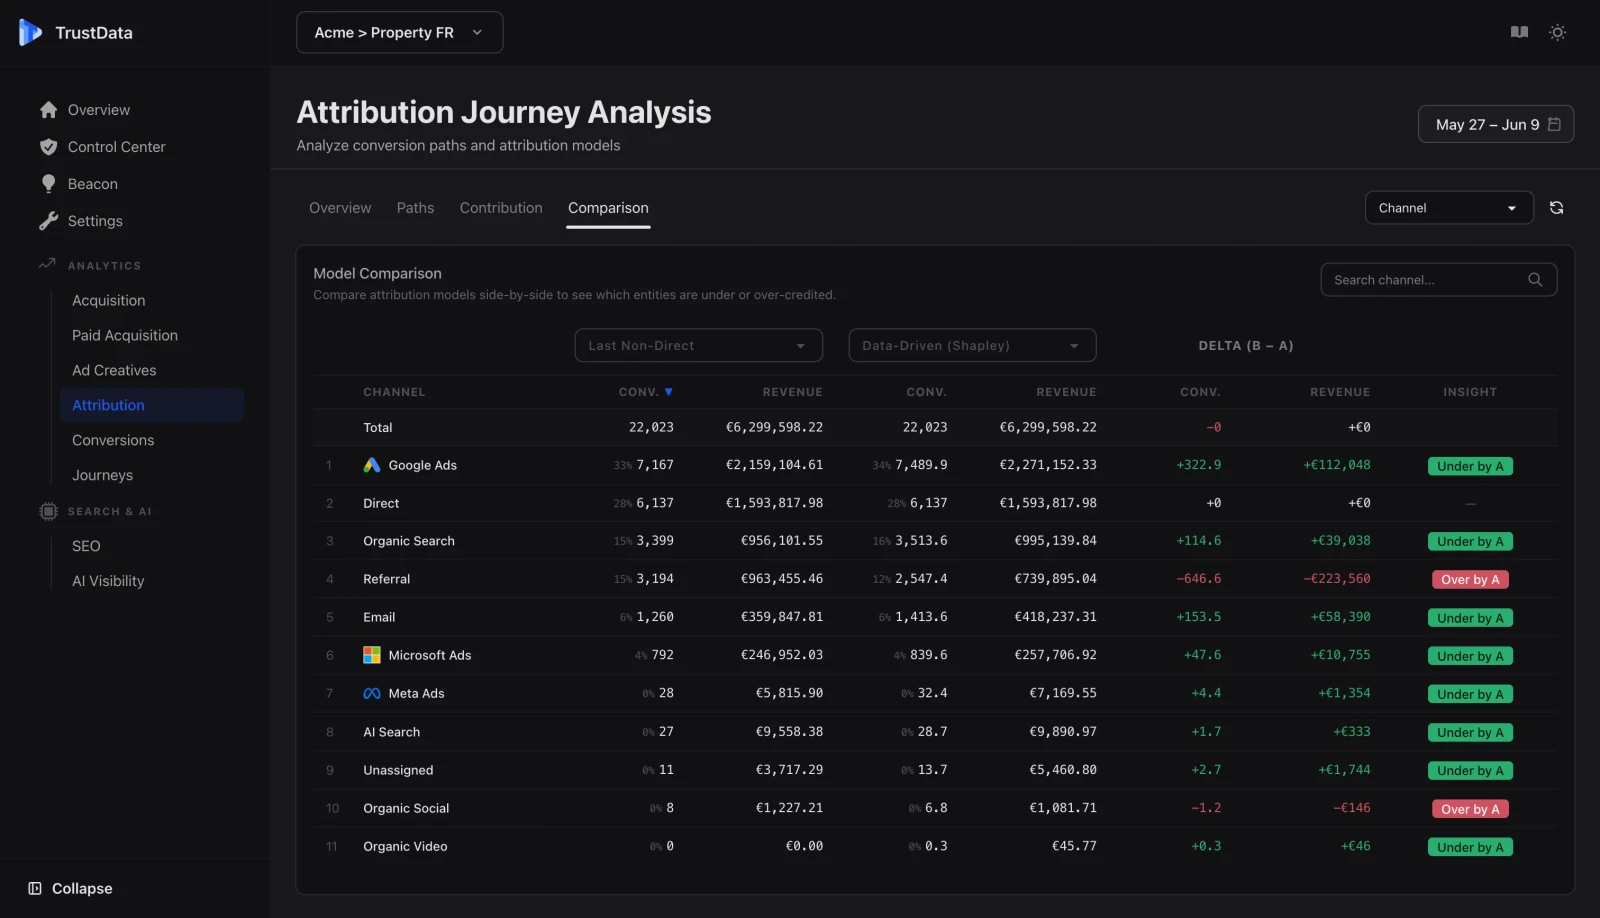
Show a stakeholder what platform bias costs, in one screen. Run last-click against data-driven attribution on the same conversions and read the gap yourself.
No citation-to-revenue bridge and no lift figure from an experiment nobody has run, listed on the pages they apply to.
The exit
Being technically capable means eventually wanting the data somewhere else, whether that is a notebook, a warehouse or the next tool. A platform that makes that hard has made a decision about you.
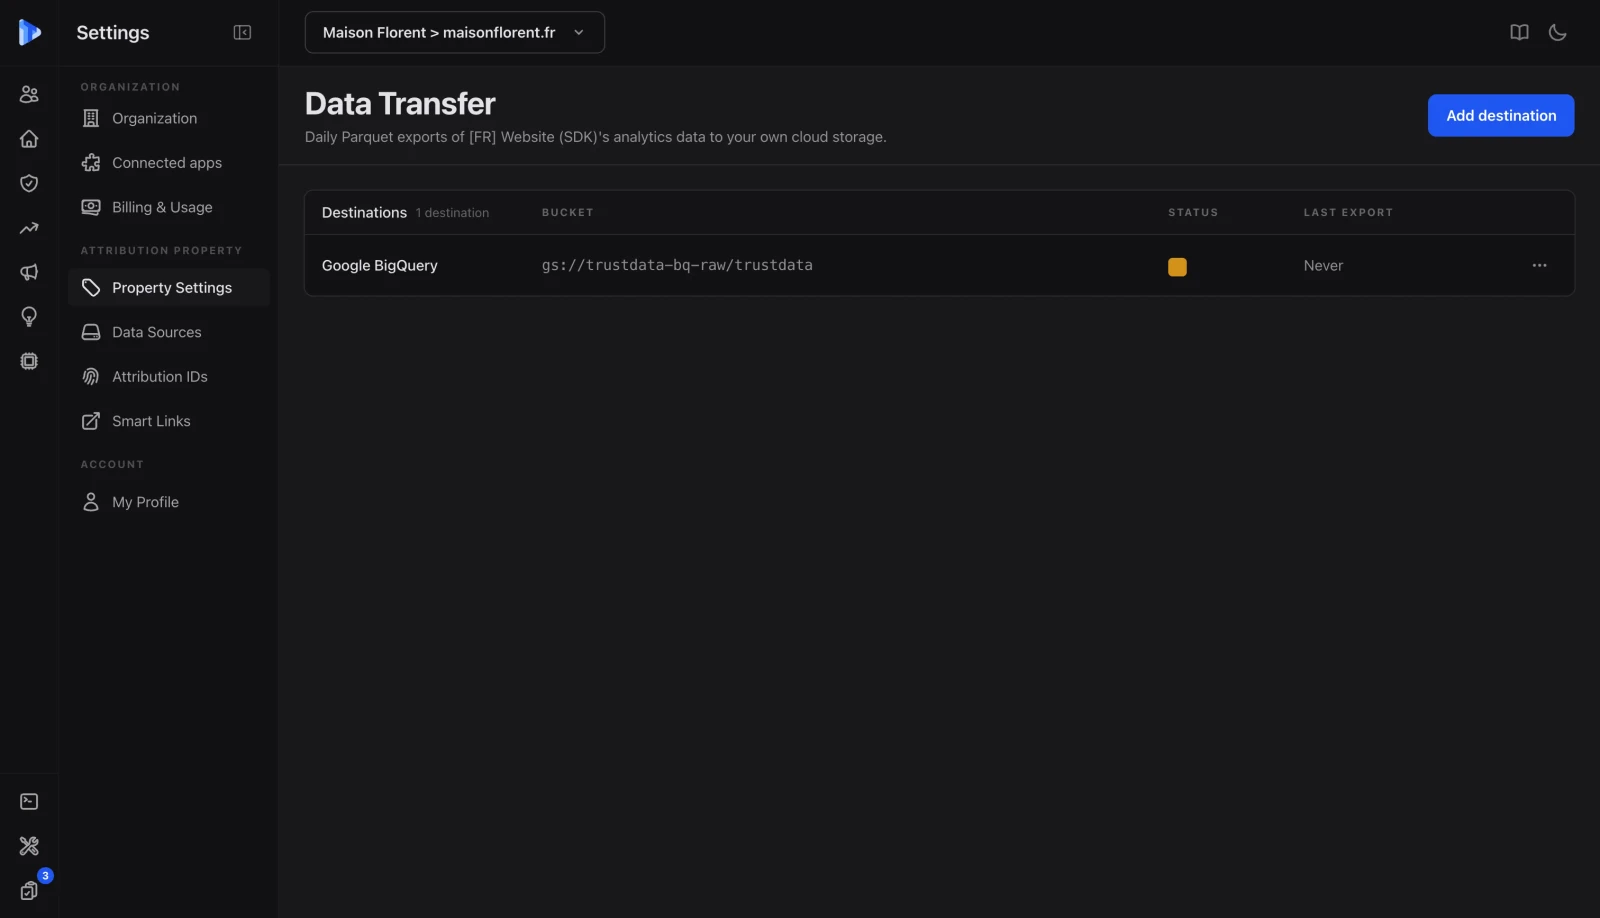
Events and attribution tables to Google Cloud Storage or Amazon S3, in Parquet or CSV, on the schema the interface reads.
Nothing is aggregated away at a plan boundary, which is the quiet way most tools make leaving expensive.
The MCP server connects Claude, ChatGPT or Cursor to the same deduplicated numbers your team reads.
FAQ
GA4 tells you what happened on the site and takes no position on whether your ad platforms are over-claiming. A BI tool visualises whatever you load into it and takes no position on whether the numbers are right. The layer missing between them is a single conversion definition, reconciled against your real orders, that every channel is measured on. That, plus the tracking audits that tell you when the collection underneath has quietly broken.
That is the design goal. Thresholds are published as numbers, attribution models can be run side by side so the gap between last-click and data-driven is visible rather than asserted, and every investigation states its confidence layer and whether it matched a known pattern or only reported facts. Where a claim cannot be made honestly, the page says so instead of hedging.
One snippet in the head for collection, five minutes. Connectors are OAuth, a couple of clicks each, with historical data loading on first connection. Custom events and server-side forwarding take about half an hour with the documentation open. There is no data team requirement and no warehouse prerequisite, which is the point: the whole thing is aimed at a capable person who does not have three months.
Yes, and while you are a customer rather than only on the way out. Raw events and attribution tables export to your own Google Cloud Storage or Amazon S3 bucket in Parquet or CSV, on the same schema the interface reads, with no retention limit deleting history first. A data-ownership claim you can only test at cancellation is not a claim.
Possibly, and it depends on your spend. Below roughly 50,000 EUR a month in ad spend, a cheaper single-purpose tool is usually the right buy and we would rather tell you that than sell you a platform you will underuse. Above it, the reconciliation problem and the time cost of anomaly triage are usually worth more than the subscription.
14-day free trial
14-day free trial. Tracking audits, anomaly investigations and raw export are on every plan, including Measure.