Your orders are the denominator
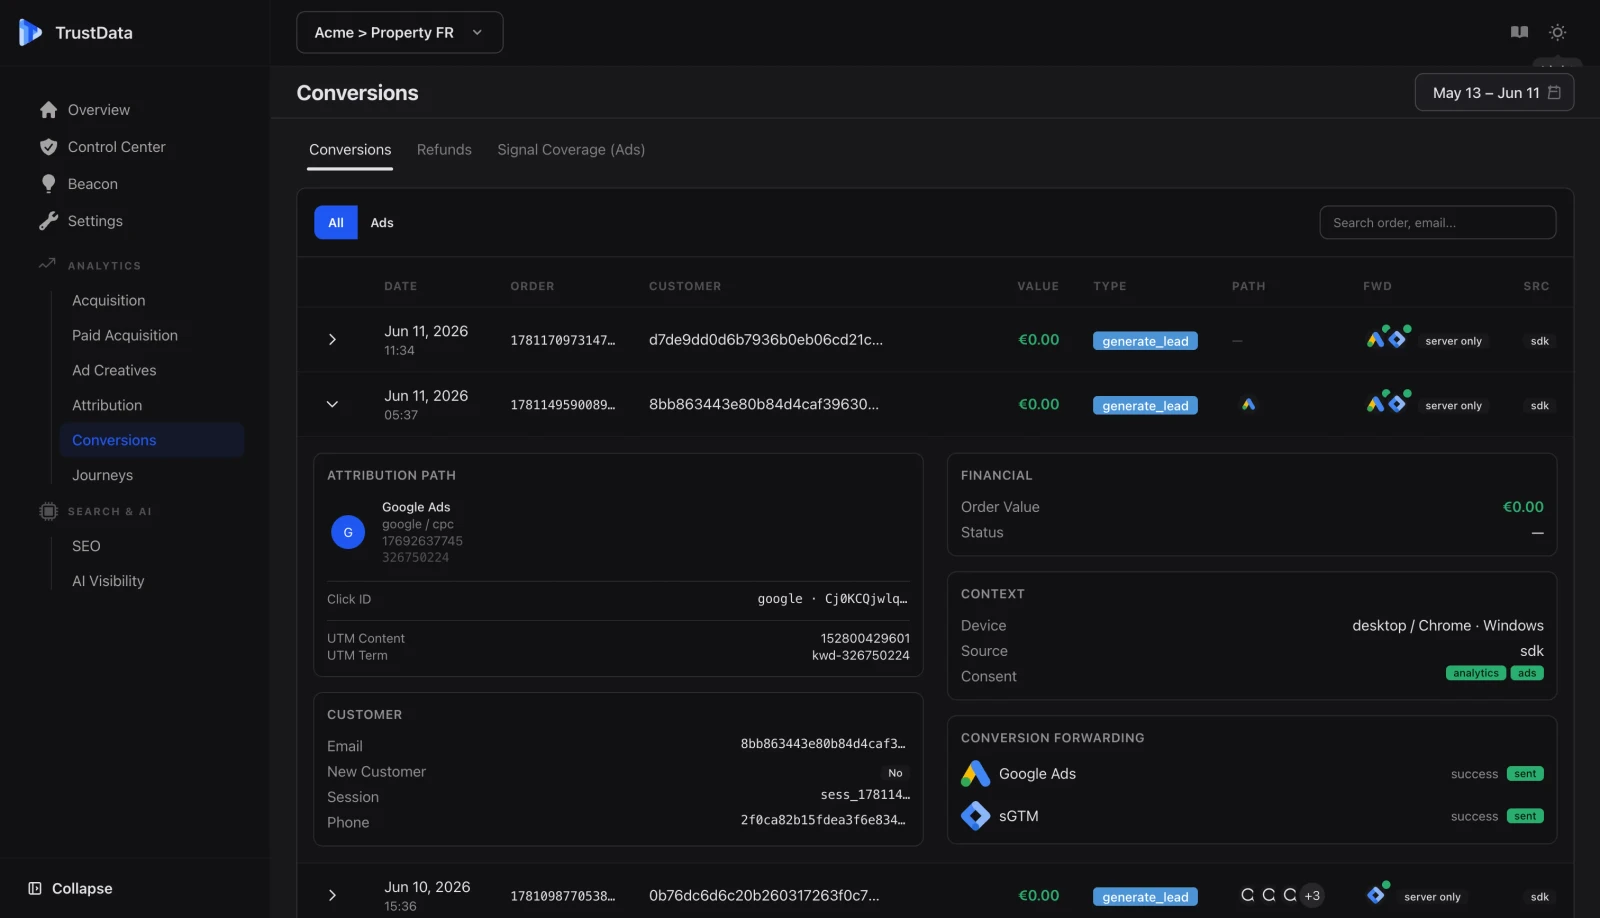
Conversions come from Shopify or your CRM, where most brands find their real ROAS sits 30 to 50% lower.
Key takeaway
Your on-site behaviour and your ad spend are read against one deduplicated conversion, so the two halves of the funnel stop reporting different totals for the same week. The reconciliation spreadsheet exists because nothing else does this.
Ground truth
Google reports 100 conversions, Meta reports 120, your store recorded 80. Everything on this page starts from the 80, because that is the number you can check against a bank statement, and the gap is the double count rather than a rounding error.
Conversions come from Shopify or your CRM, where most brands find their real ROAS sits 30 to 50% lower.
The same conversion definition feeds the on-site view, the paid view and every attribution model, so a discrepancy is a finding.
Order value carries through, so volume at a low basket does not outrank fewer, larger orders.
On-site
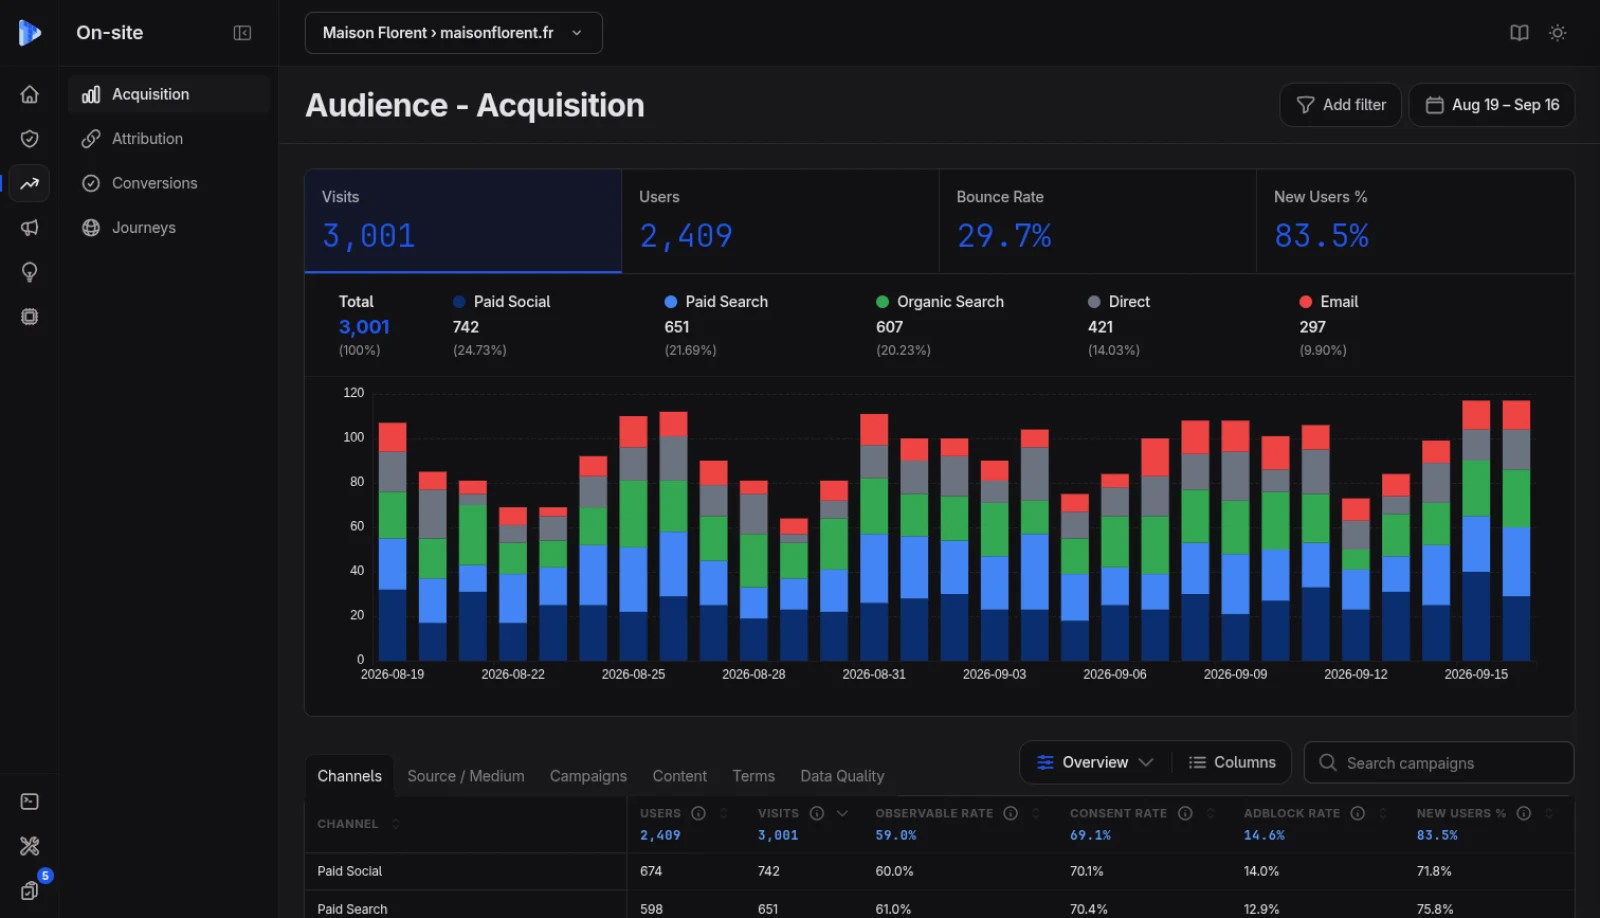
The behavioural half. Where visitors came from, what they did, and the sequence that ended in an order, all on first-party events collected from your own domain rather than sampled by a tag that half your traffic blocks.
Organic, paid, direct and AI-referred traffic, measured the same way rather than each source grading itself.
Every order carries its timestamp, its value and the touchpoints that led to it, so the model is a choice rather than an inheritance.
The sequences that appear most often in converting paths, the typical touchpoint count and how long a journey runs.
Paid
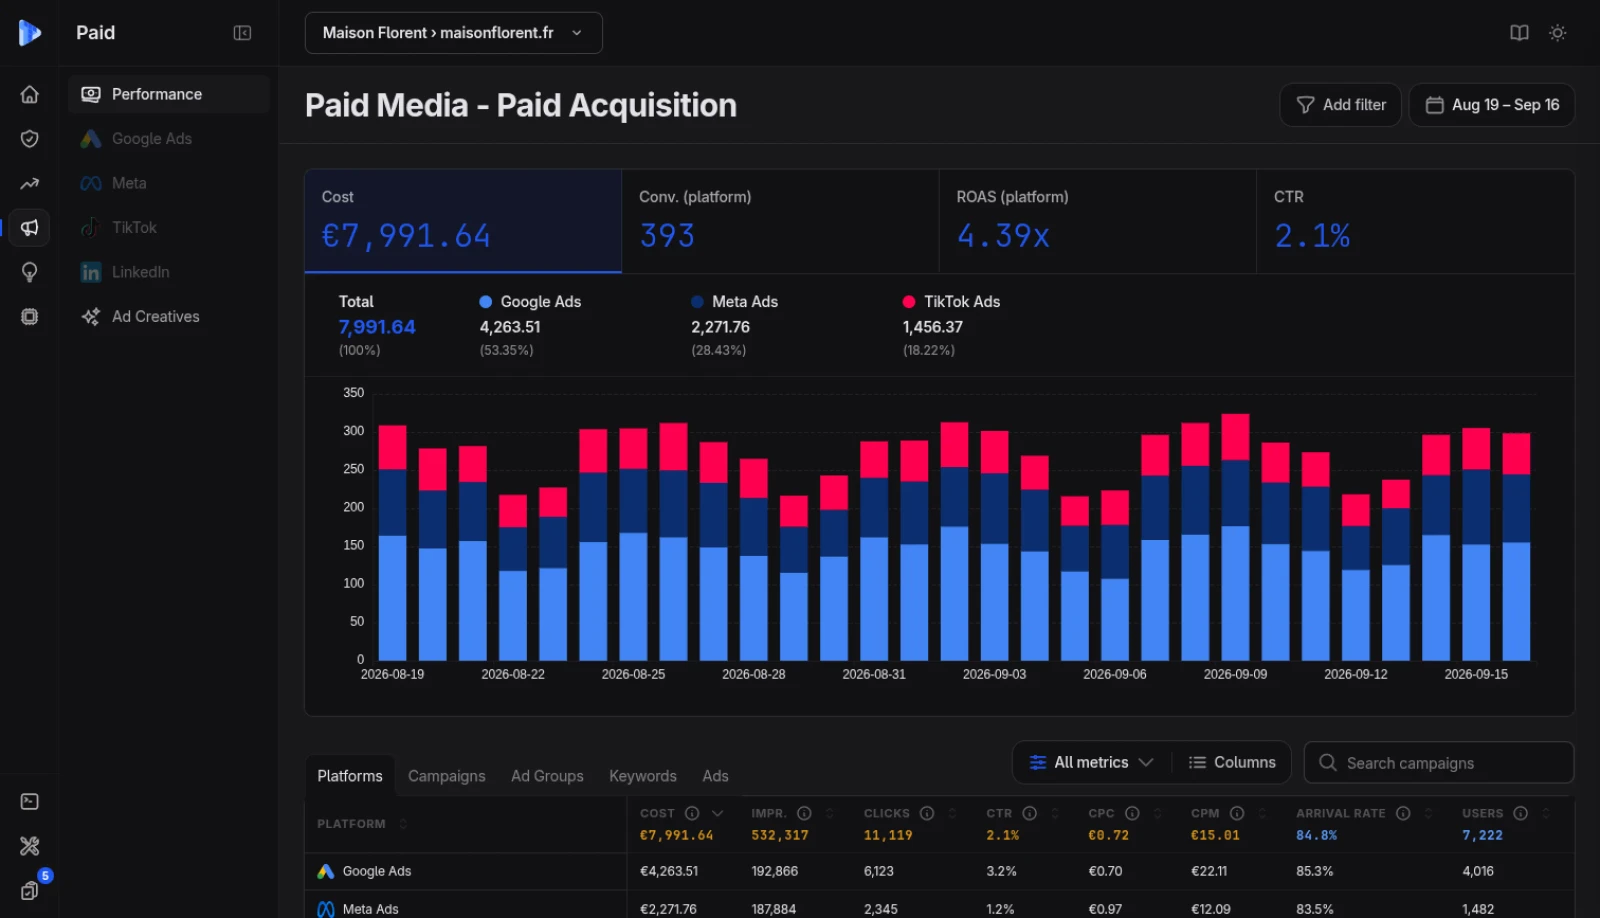
The spend half, on the same conversion. One all-platform view to compare channels, then per-platform depth when a channel is the thing you are actually working on, without leaving the number you trust behind.
Google Ads, Meta, TikTok and LinkedIn on spend, conversions and deduplicated ROAS. No platform dashboard sees this.
Channel to campaign to ad group to creative, filtered by date, device and country.
Platform-reported sits next to deduplicated, per channel, so the meeting moves from whose figure is right to what to do.
Attribution
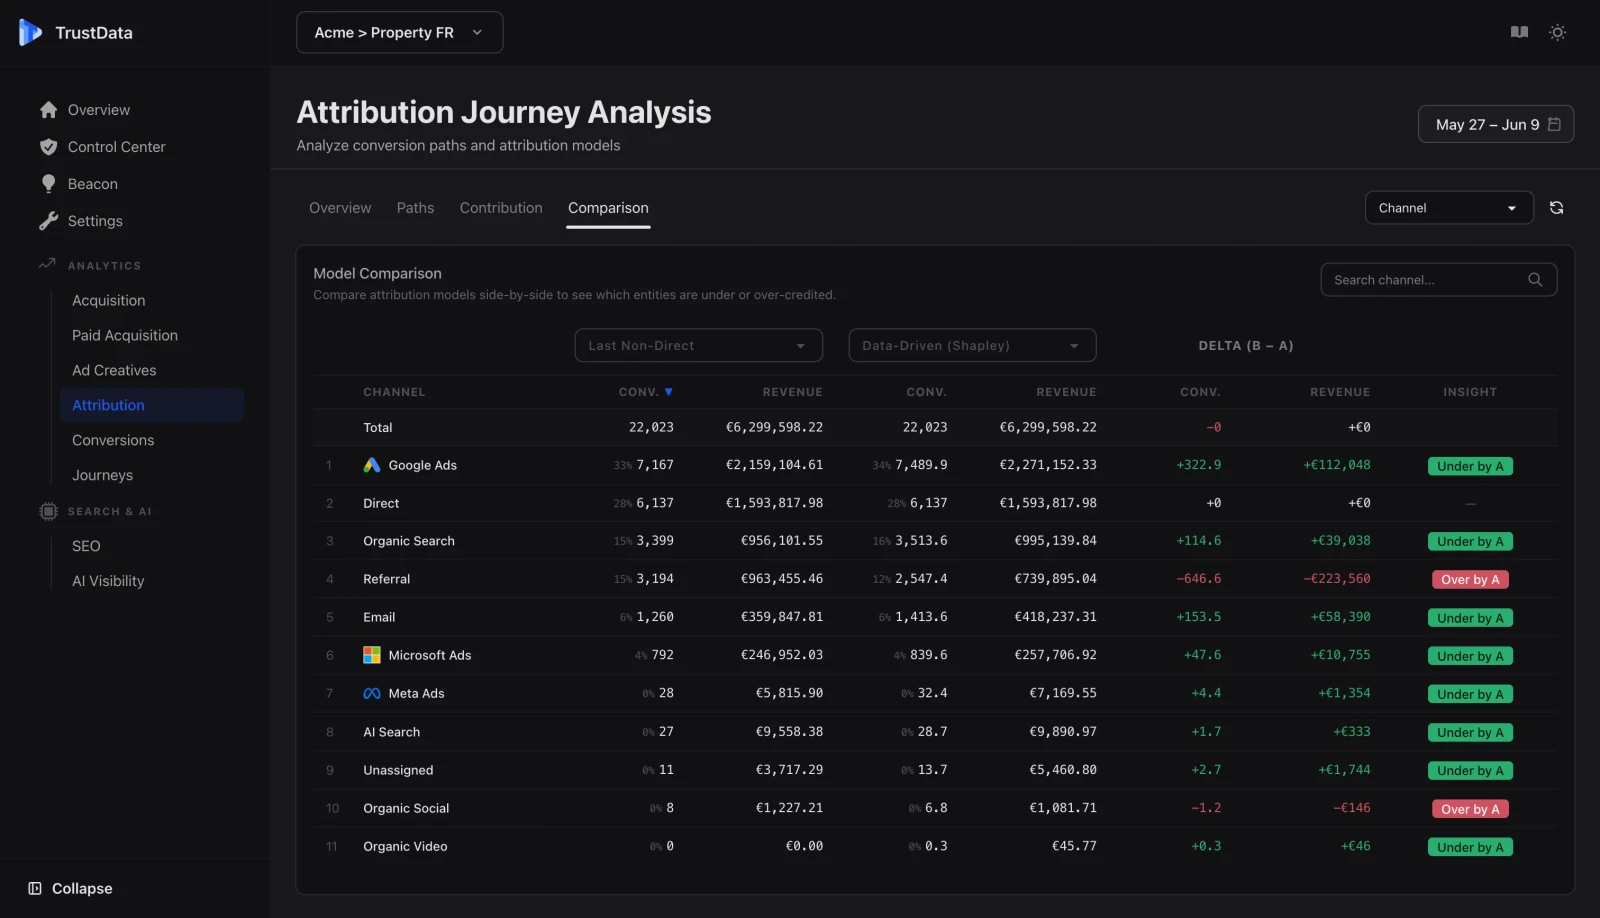
A single model is a single opinion about how credit should work. Running several on the same deduplicated conversions turns the disagreement between them into information, starting with the gap between last-click and data-driven attribution.
Across every combination of channels in your observed paths, not a share handed out by a fixed rule.
Run last-click against DDA on the same conversions, the clearest picture of platform bias you will get.
First-click, linear, time decay, and position-based at 40, 40 and 20 when both ends matter.
DDA splits each channel's credit between opening and closing. Whether that credit was causal belongs to incrementality.
The settings and exports that stay one click away, so the story above does not have to carry them.
Windows of 7, 14, 30 or 90 days, configurable per analysis, with all six models running on whichever one you pick.
First-party events from your own domain, orders from Shopify or your CRM, and spend from the connected ad accounts.
A Monday summary of the week's moves, plus CSV and raw export to your own storage, with no retention limit.
The difference is whether the two halves of the funnel are measured against the same conversion.
On-site behaviour and paid performance in one view
TrustData
Google Analytics 4
PartialOther tools
RarelyConversions deduplicated against your own orders
TrustData
Google Analytics 4
Other tools
SometimesPlatform-reported and deduplicated shown side by side
TrustData
Google Analytics 4
Other tools
Six attribution models on the same window
TrustData
Google Analytics 4
LimitedOther tools
Usually 3 to 4Drill to creative without losing the conversion definition
TrustData
Google Analytics 4
PartialOther tools
SometimesRaw events exportable to storage you own
TrustData
Google Analytics 4
Via BigQueryOther tools
Rarely| Feature | TrustData | Google Analytics 4 | Other tools |
|---|---|---|---|
| On-site behaviour and paid performance in one view | Partial | Rarely | |
| Conversions deduplicated against your own orders | Sometimes | ||
| Platform-reported and deduplicated shown side by side | |||
| Six attribution models on the same window | Limited | Usually 3 to 4 | |
| Drill to creative without losing the conversion definition | Partial | Sometimes | |
| Raw events exportable to storage you own | Via BigQuery | Rarely |
FAQ
Each platform reports from its own perspective, applies its own attribution window, and counts an assisted conversion as a full conversion. One purchase can appear as 1 order in your store, 1.4 conversions in Google Ads on a 30-day window, and 1.2 conversions in Meta Ads on a 7-day click. TrustData starts from your Shopify orders or your CRM, deduplicates across platforms, and only then applies a model, so total credited conversions always equals the orders you actually took. The gap between the two views is typically 30 to 50%.
Data-driven attribution is a statistical model that uses your actual conversion data to calculate the marginal contribution of each marketing channel. Unlike rule-based models such as last-click, first-click or linear, it analyses converting and non-converting paths together to work out which touchpoints genuinely changed the outcome. TrustData's DDA is built on a cooperative game theory framework, so a channel's credit is its average marginal contribution across every combination of channels it appears in, rather than a share handed out by a fixed rule.
No, and it should not. Keep Google Ads and Meta Ads for campaign management and bidding, because those platforms need their own signal to optimise against. TrustData answers a different question: how should the total budget be split across channels, given deduplicated conversions measured the same way on every surface. One is in-platform optimisation, the other is cross-platform allocation, and using the first to answer the second is what produces the over-reporting in the first place.
No. We do not replace Looker, Metabase or a warehouse. The difference is that a BI tool visualises whatever you load into it and takes no position on whether the numbers are right, while this starts by deciding what a conversion is and measures every channel against that one definition. If you want the raw rows in your own warehouse you can have them, exported to your storage on the same schema the interface reads, and you can build whatever you like on top.
No, and nothing here will imply it does. Every attribution model, DDA included, distributes credit among the touchpoints that were present. None of them can tell you what would have happened if the ad had never run, because that path does not exist in your data. Answering that needs a controlled experiment with an untreated control group, which is what the incrementality page covers, including the fact that no customer test has concluded yet. Attribution tells you where the credit went. Only an experiment tells you whether the credit was real.
14-day free trial
14-day free trial. On-site behaviour, paid performance and six attribution models, all on one deduplicated conversion.