Dashboard
Every channel on the same conversion
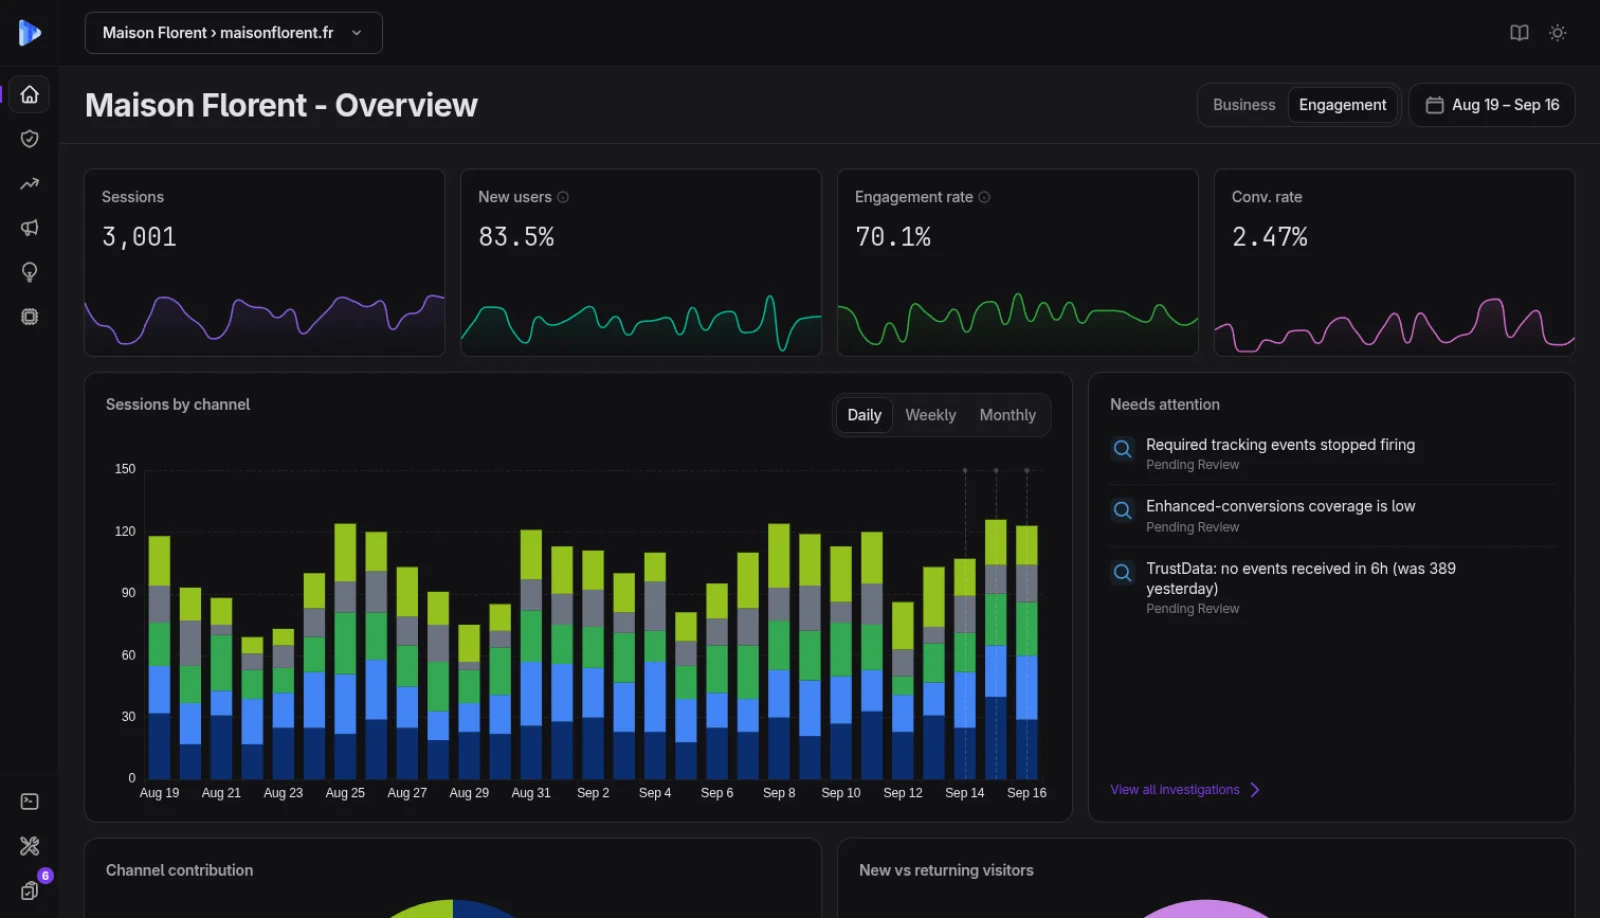
Revenue, ROAS, spend and conversion volume across Google, Meta, TikTok and every organic source, deduplicated against your real orders.
Key takeaway
Reporting goes wrong in one specific way: the deck is assembled somewhere the dashboard is not, so the two drift and somebody spends Thursday reconciling them. Here the report reads the same deduplicated conversion the screen shows, which is why there is nothing to reconcile.
The view
The Monday question is always the same: what moved, and does it matter. Answering it should not require opening two ad managers, an analytics property and a spreadsheet that reconciles them.
Revenue, ROAS, spend and conversion volume across Google, Meta, TikTok and every organic source, deduplicated against your real orders.
Top-line ROAS to campaign, ad group and creative, filtered by date, channel, device or country.
Tracking errors, ROAS decay and connector failures surface as they are detected.
The report
A weekly recap is worth having only if nobody has to write it. This one is assembled from the same numbers the dashboard shows and lands in your inbox, which is what turns the monthly deck from a scramble into an edit.
The three to five moves in ROAS, spend, revenue and conversion rate worth knowing before your stand-up.
The week's tracking issues, ROAS decay and connector failures, each summarised with its likely cause.
The weekly narrative reads against the strategy you set in Beacon.
MCP
A dashboard is one way to read the data, not the only one. The MCP server hands Claude, ChatGPT or Cursor the same deduplicated tables the dashboard reads, so an agent answering a question and an analyst opening a tab are working from one source instead of two exports.
Ask what Meta ROAS was last week and get what your team already sees. No SQL, no export.
Connect the assistants your team already has open.
The MCP server ships with every tier, including Measure, rather than being sold separately or held back for the larger plans.
For agencies
For an agency the report is the product the client actually sees. It has to carry your name, arrive without a production cycle, and survive the client checking it against their own store.
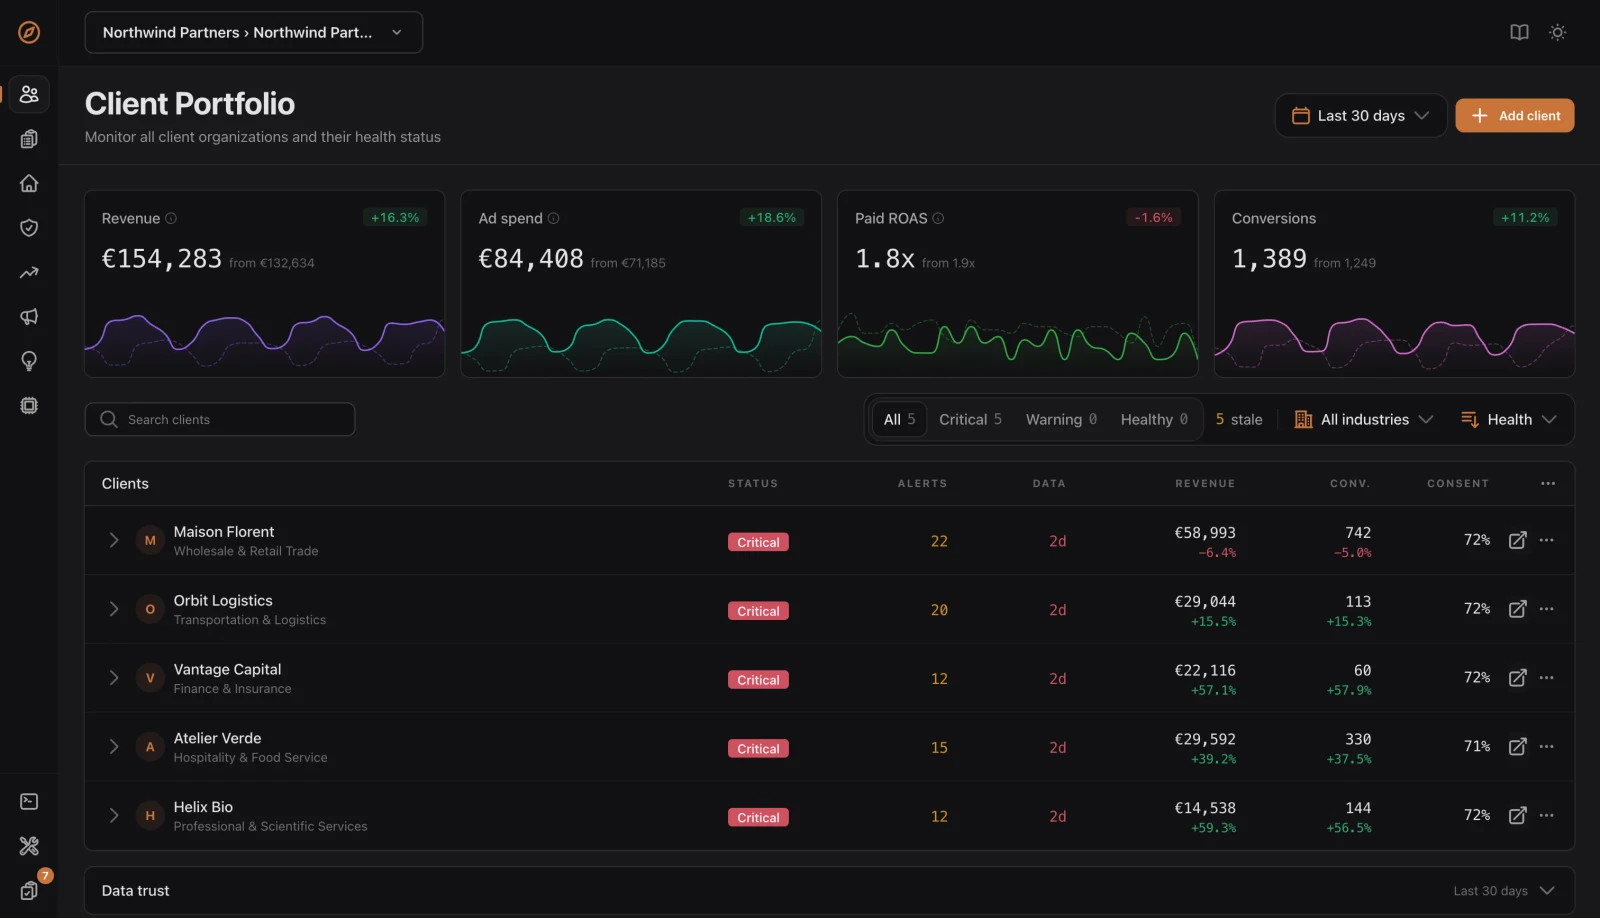
Ship it under your logo, your domain and your colours. The client never learns which platform produced the numbers.
Run every account from one login, with data isolated per client.
Set access per client to full dashboard, read-only or report-only. Some want to log in, some want a PDF.
One exchange, as it happens
The question, the answer, what Meta shows on its side, and why the two differ.
Claude, what is my Meta ROAS over the last 7 days?
Slack, export, two languages and the whole history.
Push weekly summaries and anomaly alerts into Slack, where the conversation already happens.
Export to CSV, or push raw events and attribution tables to your own bucket in Parquet on the schema the dashboard reads.
Dashboard and reports both ship in both languages, which matters when your team works in one and your client reports in the other.
Query a year-old cohort without asking anyone. There is no retention limit and nothing gets aggregated away at a plan boundary.
FAQ
A BI tool visualises whatever you load into it and takes no position on whether the numbers are right, which leaves reconciliation as your job. This starts by deciding what a conversion is, reconciles every platform's claim against your real orders, and only then draws anything. We do not replace Looker or Metabase, and if you want the raw rows in your own warehouse you can export them on the same schema the interface reads.
That is your call, set per client. Options are full dashboard access, read-only access to their own data, report-only delivery, or no direct access at all. Data is fully isolated per client, so a client can never see another client's numbers, which is the question that comes up the first time a prospect asks whether you also work with their competitor.
The three to five moves in ROAS, spend, revenue and conversion rate worth knowing before your Monday stand-up, plus every alert that fired during the week with its likely cause. If you have set a strategy in Beacon it is paced against that target rather than reported in isolation, so it says ahead or behind rather than just up or down.
They cannot. Both read the same deduplicated conversion, computed once from your Shopify orders or CRM. That is deliberate and it is the whole point of this page: the common failure in agency reporting is a deck assembled somewhere the dashboard is not, which drifts and then has to be defended in a meeting.
Yes, on every plan. Logo, domain and colours across both the dashboard and the reports, so a client logging in sees your brand throughout. Reports can be scheduled or shared as a link, and nothing forces you to expose the underlying platform to a client who only wants the monthly summary.
Yes, over the MCP server, which ships on every tier, including Measure. Claude, ChatGPT and Cursor connect to the same deduplicated tables the dashboard reads, so asking an agent what Meta ROAS was last week returns the number already on the dashboard. There is no SQL to write and no export to keep in sync, which is the point: a second copy of the data is a second version of the truth.
14-day free trial
14-day free trial. The dashboard, the weekly recap and white-label reporting are on every plan.